This post will show how to visualize data with ipython.
matplotlib
- install:
pip install matplotlib
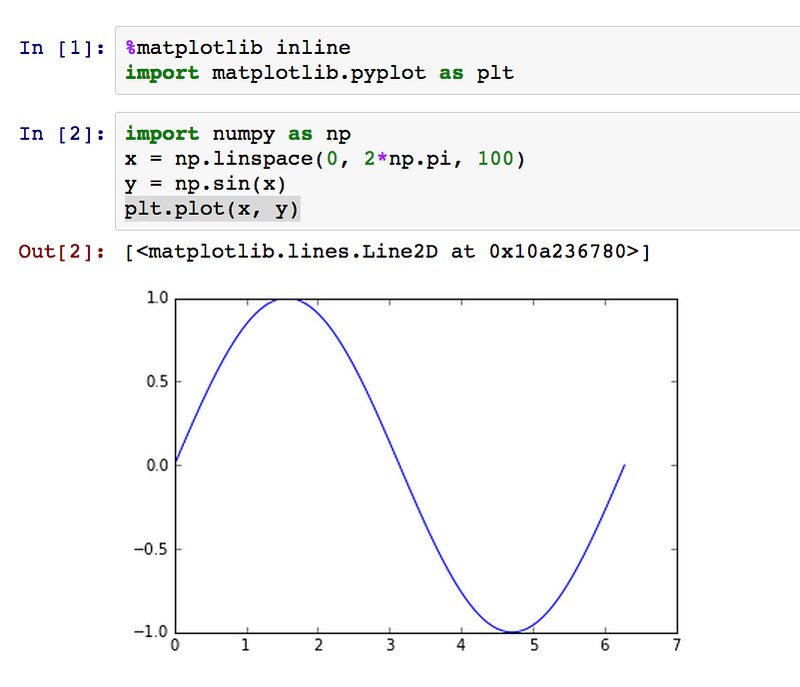
With matplotlib, we are able to make inline plots by setting
%matplotlib inline
import matplotlib.pyplot as plt
e.g.
mpld3
- install:
pip install matplotlib
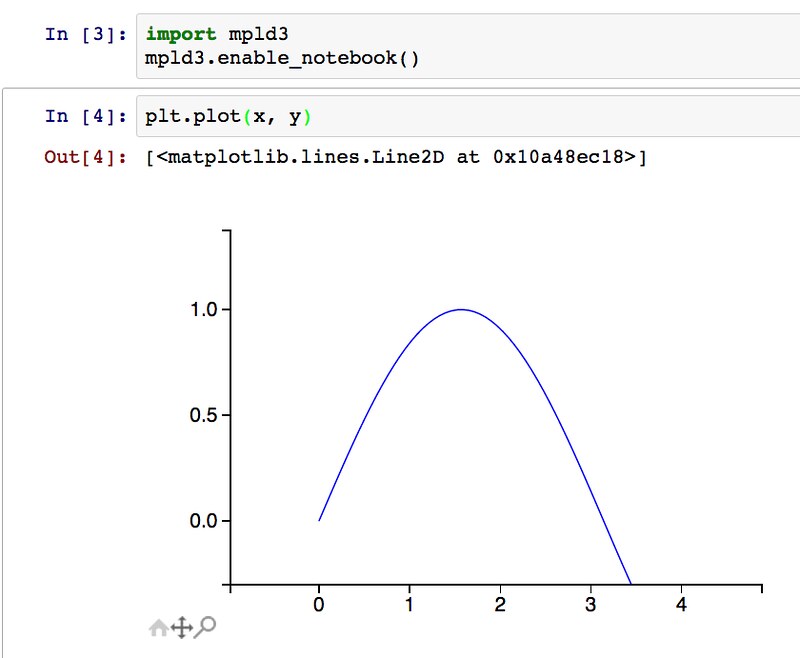
With mpld3, it is handy to zoom in/out or shift the plot through the lower left icons.
To use mpld3, the following lines are required.
import mpld3
mpld3.enable_notebook()
e.g.
Comments
comments powered by Disqus