In this post, we will introduce the cell-averaging CFAR(Constant False Alarm) algorithm to detect peaks of signals.
Theory

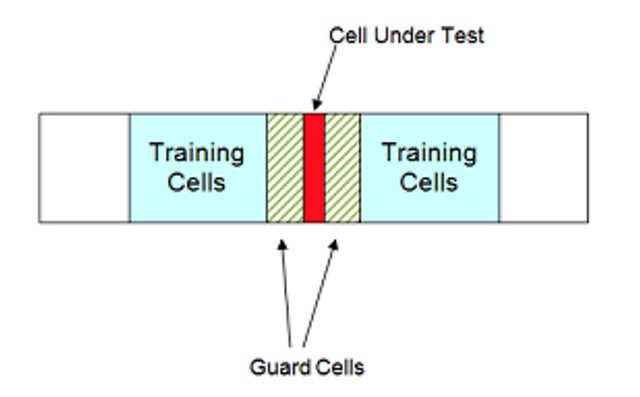
[This picture is copied from Matlab doc]
In this figure, the CUT (Cell Under Test) is to be tested if its value is greater than threshold level or not. The threshold level is calculated from the estimated noise power of the training cells. The guard cells are used to avoid corrupting this estimate with power from the CUT itself, cells immediately adjacent to the CUT are normally ignored.
Assuming \(x_j\) is the value of the \(j\)th test cell, we declare that the test cell has a peak if \(x_j\) is greater than the value of adjacent cells and \(x_j > T\), where T is the threshold.
where \(\alpha\) is the threshold factor, \(P_n\) stands for the noise power of training cells, \(N\) is the number of training cells and \(P_{fa}\) means the false alarm rate.
Form the equations above, we can observe that lower false alarm rate will lead to higher threshold level.
Code example
This example demonstrates how to implement cell-averaging CFAR with python.
%load_ext autoreload
%autoreload 2
%matplotlib inline

import numpy as np
import matplotlib.pyplot as plt

# Plot settings
plt.rcParams['figure.figsize'] = (20, 5) # set default size of plots
plt.rcParams['image.interpolation'] = 'nearest'
plt.rcParams.update({'font.size': 22})
def detect_peaks(x, num_train, num_guard, rate_fa):
    """
    Detect peaks with CFAR algorithm.

    num_train: Number of training cells.
    num_guard: Number of guard cells.
    rate_fa: False alarm rate.
    """
    num_cells = x.size
    num_train_half = round(num_train / 2)
    num_guard_half = round(num_guard / 2)
    num_side = num_train_half + num_guard_half

    alpha = num_train*(rate_fa**(-1/num_train) - 1) # threshold factor

    peak_idx = []
    for i in range(num_side, num_cells - num_side):

        if i != i-num_side+np.argmax(x[i-num_side:i+num_side+1]):
            continue

        sum1 = np.sum(x[i-num_side:i+num_side+1])
        sum2 = np.sum(x[i-num_guard_half:i+num_guard_half+1])
        p_noise = (sum1 - sum2) / num_train
        threshold = alpha * p_noise

        if x[i] > threshold:
            peak_idx.append(i)

    peak_idx = np.array(peak_idx, dtype=int)

    return peak_idx

y = np.sin(2*np.pi*5*np.linspace(0, 1, 200)) + np.random.randn(200)/5
x = np.arange(y.size)

# Detect peaks
peak_idx = detect_peaks(y, num_train=10, num_guard=2, rate_fa=1e-3)
print("peak_idx =", peak_idx)

plt.plot(x, y)
plt.plot(x[peak_idx], y[peak_idx], 'rD')
plt.xlabel('x')
plt.ylabel('y')
References
[2] Constant False Alarm Rate (CFAR) Detection